This component of the Space Academy includes a series of webinars covering topics related to the use of EO to assess and monitor the state of water and food security-related spatial components. Each Webinar consists of three sections: theoretical background, applications examples a Q&A session.
The selected topics for the webinars include:
22th on the EO AFRICA R&D Facility Webinar Series
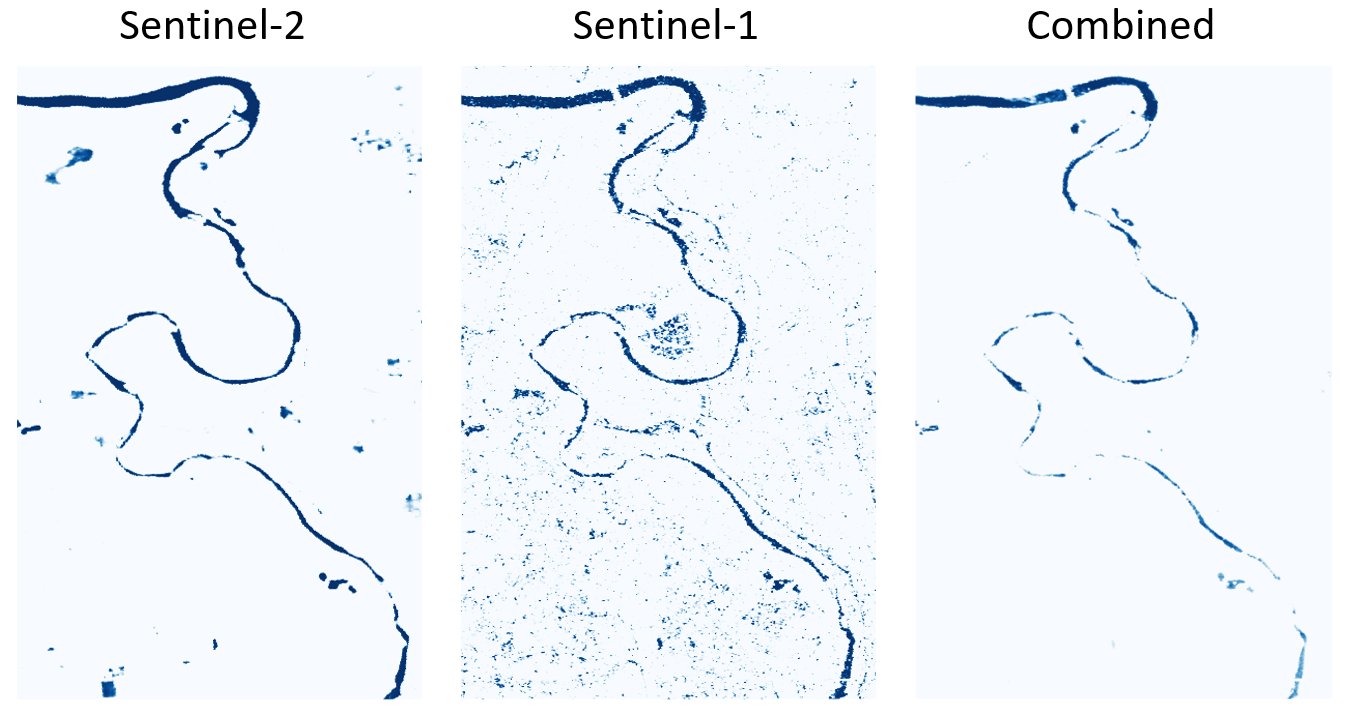
Combining Optical and SAR Data for Mapping Water Bodies and Floods
Details
Accurate and timely mapping of water bodies and flood extents is essential for water resource management, environmental monitoring, and disaster risk reduction. While optical satellites can capture surface water with high accuracy, their utility is often limited by cloud cover and poor lighting conditions, especially during flood events. In contrast, Synthetic Aperture Radar (SAR) offers reliable, all-weather, day-and-night monitoring, but SAR-derived maps are prone to ambiguities and speckle noise. Integrating optical and SAR data can help mitigate these individual limitations, but the challenge lies in how best to combine them.
One strategy is to feed contemporary optical and SAR imagery directly into a classification model—typically a machine learning model—to generate binary surface water maps. However, this approach functions as a black box, offering little insight into which input data channels drive classification, and it only reflects features visible in the images, not areas where detection is not possible. An alternative approach is to produce water maps separately from each sensor and then merge them. Although this reduces the classification’s feature space and may impact robustness, it provides transparency about sensor contributions and the role of acquisition timing in the final result.
This webinar will discuss an approach for integrating Sentinel-2 (optical) and Sentinel-1 (SAR) water maps that was inspired by the Copernicus Global Flood Monitoring service, which combines flood likelihood maps from different SAR algorithms into an ensemble flood product (Wagner et al. 2025).
The duration of the webinar is 1 hour, followed by a live Q&A session. During the webinar there is a live-chat available as well.
The webinar will be executed under the framework of the EO AFRICA R&D Facility by the Vienna University of Technology (TU Wien)
Presenter:
-

Head of the Research Group Microwave Remote Sensing
https://tiss.tuwien.ac.at/person/47741?locale=en
wolfgang.wagner@geo.tuwien.ac.at
Downloads and recordings:
You can find the recording of the webinar in our YouTube Channel or you can watch it here:
21th on the EO AFRICA R&D Facility Webinar Series
Deriving Water Quality Indicators and Indices from Sentinel-2 Using Cloud Computing
Webinar Overview
Effective monitoring of water quality is essential for addressing challenges such as pollution control, ecosystem health, and sustainable resource management. The advent of Copernicus Sentinel-2 satellite data has transformed water quality monitoring by providing high-resolution observations on a global scale. When combined with cloud computing platforms, these technologies enable detailed analyses of aquatic ecosystems, offering insights into their dynamics and health.
This webinar will explore the methodologies for deriving water quality indicators from Sentinel-2 data using cloud computing. We will discuss the distinctions between indicators and indices in the context of Earth Observation (EO) and demonstrate how standardized anomalies can be utilized to detect pollution events effectively.
Key Topics
- Understand the key features and latest developments of openEO.
- Overview of Sentinel-2 capabilities in monitoring aquatic environments.
- Advantages of using cloud computing platforms for processing large EO datasets.
- Deriving Water Quality Indices from Sentinel-2 Data:
- Differentiate between water quality indicators and indices that could be derived from EO.
- Techniques for extracting indices like chlorophyll-a and turbidity indices using Sentinel-2 imagery.
- Case studies demonstrating the application of these techniques in various water bodies.
- Pollution Detection:
- Introduction to standardized anomalies and their significance in identifying deviations from normal conditions.
- Approaches to calculating standardized anomalies using time-series data from Sentinel-2.
- Case study: Utilizing standardized anomalies to evaluate the state of water quality.
- Leveraging Cloud Computing for EO Data Processing:
- Benefits of using cloud-based platforms for processing and analyzing large-scale EO data.
- Demonstration of workflows for deriving water quality indices and standardized anomalies.
Learning Outcomes
By the end of this webinar, participants will:
- Understand the capabilities of Sentinel-2 in water quality monitoring.
- Differentiate between water quality indicators and indices in the context of EO.
- Gain insights into deriving and analyzing water quality indices using cloud computing platforms.
- Learn how standardized anomalies can be applied to detect and monitor pollution events effectively.
Target Audience
This webinar is designed for environmental scientists, remote sensing specialists, water resource managers, and policymakers interested in leveraging EO data and cloud computing for enhanced water quality monitoring and management.
This webinar aims to equip participants with the knowledge and tools necessary to harness Sentinel-2 data and cloud computing for effective water quality monitoring and pollution detection.
References that you can use
- Arcari, A. L., Tavora, J., van der Wal, D., & Salama, M. S. (2023). The Wastewater Contamination Index: A methodology to assess the risk of wastewater contamination from satellite-derived water quality indicators. Frontiers in Environmental Science.
- Dias, M. A., Silva, E. A. d., Azevedo, S. C. d., Casaca, W., Statella, T., & Negri, R. G. (2020). An Incongruence-Based Anomaly Detection Strategy for Analyzing Water Pollution in Images from Remote Sensing. Remote Sensing, 12(1), 43.
- Hafeez, S., Wong, M. S., Abbas, S., Kwok, C. Y. T., & Nichol, J. (2019). Detection and Monitoring of Marine Pollution Using Remote Sensing Technologies. Monitoring of Marine Pollution.
- MAGO Water Quality Monitoring Tool. Sentinel Hub Custom Scripts.
The duration of the webinar is 1,5 hours: 1 hour presentation followed by 30 minutes Q&A. During the webinar, there is a live chat available.
The webinar will be executed under the framework of the EO AFRICA R&D Facility by UTwente-ITC
Staff:
-
Associate Professor – Faculty of Geo-information Science and Earth Observation (ITC), University of Twente.
https://people.utwente.nl/s.salama
s.salama@utwente.nl
Downloads and recordings:
You can find the recording of the webinar in our YouTube Channel or you can watch it here:
20th on the EO AFRICA R&D Facility Webinar Series
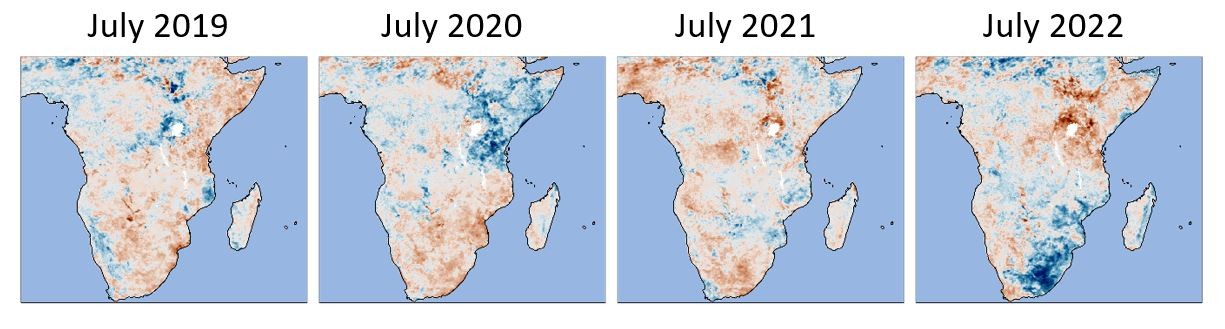
Using the new H SAF 6.25km ASCAT soil moisture data for drought monitoring
Details
Droughts are among the most destructive climate-related hazards, yet they often receive less immediate attention compared to rapid-onset disasters like floods. Their gradual development allows harmful conditions to build up before the full extent of the crisis is recognized. In Africa, severe droughts are frequent, leading to widespread food insecurity, livestock losses, and the displacement of a large number of people. This highlights the urgent need for more efficient, timely, and detailed drought detection and response strategies. Traditionally, drought monitoring in Africa has relied on satellite-based precipitation and vegetation indices. However, with the growing availability and refinement of satellite-derived soil moisture data, drought monitoring has the potential for significant improvement. This is because soil moisture is a more direct measure of agricultural stress than precipitation or vegetation, reflecting both rainfall and land surface temperature anomalies.
The ASCAT soil moisture service, offered by EUMETSAT, is the longest-standing operational satellite-based soil moisture services. ASCAT, which stands for Advanced Scatterometer, is an active microwave sensor onboard a series of three METOP satellites. As one of the primary microwave sensors for global soil moisture retrieval, ASCAT has been instrumental in monitoring soil moisture on a worldwide scale. The near-real-time ASCAT soil moisture service (< 3h), launched in 2008, was the first of its kind and was later incorporated into the Satellite Application Facility for Support to Operational Hydrology and Water Management (H SAF). Recently, the ASCAT soil moisture retrieval algorithm was updated, marking the biggest product improvements since the inception of the service: (i) enhanced spatial sampling (6.25 km instead of 12.5 km), (ii) improved anomaly detection thanks to algorithms that account for land cover changes, (iii) better modelling of seasonal vegetation effects, and (iv) a new data format that facilitates easier comparison of near-real-time data with historical time series. This webinar will present the key changes and explain how they contribute to improved drought monitoring.
The duration of the webinar is 1 hour, followed by a live Q&A session. During the webinar there is a live-chat available as well.
The webinar will be executed under the framework of the EO AFRICA R&D Facility by the Vienna University of Technology (TU Wien)
Staff:
-
Head of the Research Group Microwave Remote Sensing
https://tiss.tuwien.ac.at/person/47741?locale=en
wolfgang.wagner@geo.tuwien.ac.at
Downloads and recordings:
You can find the recording of the webinar in our YouTube Channel or you can watch it here:
19th on the EO AFRICA R&D Facility Webinar Series
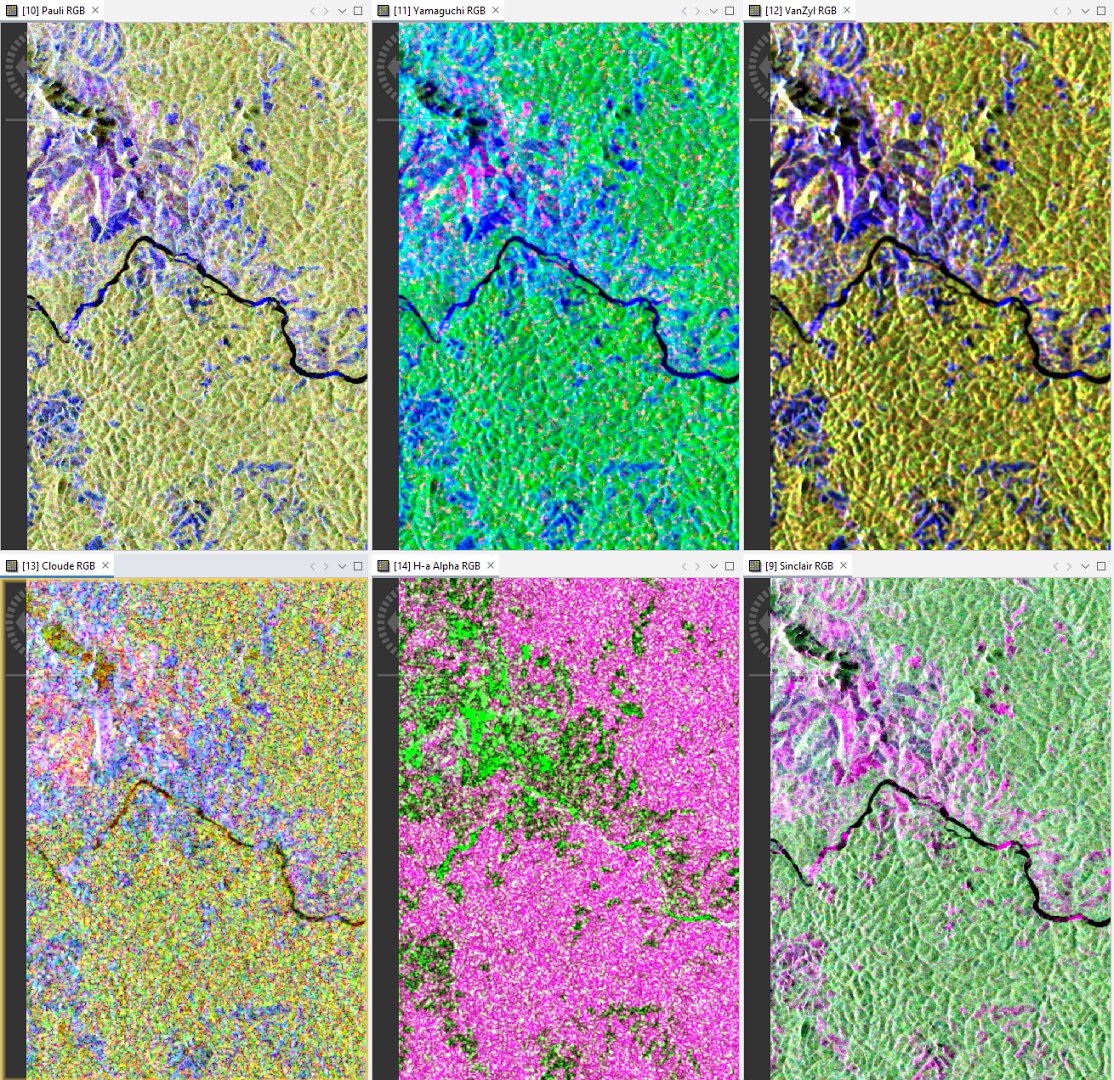
Introduction to PolInSAR for agriculture monitoring and mapping
Details
Vegetation height is a key agronomic trait, closely linked to crop type, growth stage, and potential yield. Accurate and timely estimation of vegetation height using high-resolution satellite Synthetic Aperture Radar (SAR) data enables effective monitoring of crop growth and provides critical support for agricultural management. This information is essential for classifying crop types, estimating biomass, optimizing precision fertilization practices to reduce yield variability, and assessing damages caused by pests, weather disasters, or lodging in cereal crops.
Polarimetric SAR Interferometry (PolInSAR) is a cutting-edge radar remote sensing technique that combines polarimetric and interferometric SAR data to extract structural parameters of vegetation, such as height. PolInSAR has been widely validated for forest height estimation and is being explored for agricultural applications as well. However, challenges such as temporal decorrelation—caused by environmental changes between image acquisitions—and the need for appropriate spatial baselines must be addressed to ensure reliable results. Recent advancements in satellite missions, such as TanDEM-X, ALOS-2&4, SAOCOM, RADARSAT constellation have opened new opportunities to apply PolInSAR for agriculture applications, by providing growing amount of data with global coverage to secure suitable baselines.
This webinar will introduce the fundamentals of PolInSAR technology and its possible applications in agriculture monitoring based on selected case studies in Africa. We will explore PolInSAR capabilities in estimating vegetation height and biomass, tracking phenological stages, and improving precision farming practices. Additionally, we will present tools available for accessing PolInSAR data, present and future satellite missions to provide fully polarimetric data and showcase selected case studies focused on agriculture.
This webinar is perfect for researchers, agriculture scientists, remote sensing professionals, and anyone interested in the novel applications in agriculture.
The duration of the webinar is 1 hour, followed by a live Q&A session. During the webinar there is a live-chat available as well.
The webinar will be executed under the framework of the EO AFRICA R&D Facility by Serco Italy S.P.A.
Staff:
-
Remote Sensing Specialist – SERCO Italy S.P.A.
https://www.linkedin.com/in/ewelina-dobrowolska-8180b717b/
ewelina.dobrowolska@serco.com
Downloads and recordings:
You can find the recording of the webinar in our YouTube Channel or you can watch it here:
18th on the EO AFRICA R&D Facility Webinar Series
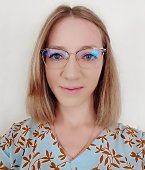
Mapping Our Planet in High Resolution: Advancing Land Cover and Degradation Monitoring with Sentinel Data
Details
Effective monitoring of global land cover is crucial for addressing challenges such as land degradation, sustainable development, and biodiversity conservation. The availability of Copernicus Sentinel-1 and Sentinel-2 satellite data has revolutionized the field of land cover monitoring, enabling high-resolution observations at unprecedented scales. These advanced Earth Observation (EO) technologies now facilitate detailed analysis of land use and land cover changes, providing insights into the dynamics of terrestrial ecosystems.
This webinar explores how these innovations, coupled with emerging datasets and services, are being utilized to monitor global land cover and land degradation, supporting sustainable development and environmental conservation. Specifically, the webinar will delve into experiences of producing the 100m Copernicus Global Land Cover dataset (available for 2015–2019), the European Space Agency (ESA) WorldCover Project, which has further advanced land cover monitoring by producing 10m resolution global land cover maps, and the new Copernicus Land Cover and Tropical Forest Monitoring Service (LCFM), designed to provide dynamic, high-resolution datasets on the status and changes of global land cover and pan-tropical forests.
Another focal point of this webinar is the ESA Sentinel for Land Degradation Neutrality (SEN4LDN) Project, which has developed, demonstrated, and validated robust and automated EO methods to map land cover changes and land productivity dynamics at high spatial resolution. This project plays a critical role in addressing the demand for high resolution datasets to enable countries to monitor progress on Sustainable Development Goal (SDG) Target 15.3, which aims to achieve land degradation neutrality.
The webinar highlights how these projects collectively address the pressing need for robust, scalable, and accessible tools for global land monitoring. By combining advanced EO technologies, such as Sentinel satellites, with open data principles, these initiatives empower a broad range of users, from policymakers to researchers and local communities. Participants will gain valuable insights into the synergies between these projects and their cumulative contributions to global environmental monitoring, land restoration efforts, and sustainable development goals.
The duration of the webinar is 1,5 hours: 1 hour presentation followed by 30 minutes Q&A. During the webinar there is a live chat available.
The webinar will be executed under the framework of the EO AFRICA R&D Facility by VITO Remote Sensing.
Staff:
-

Team Leader Vegetation – VITO Remote Sensing
https://remotesensing.vito.be/team/ruben-van-de-kerchove
ruben.vandekerchove@vito.be
Downloads and recordings:
You can find the recording of the webinar in our YouTube Channel or you can watch it here:
17th on the EO AFRICA R&D Facility Webinar Series
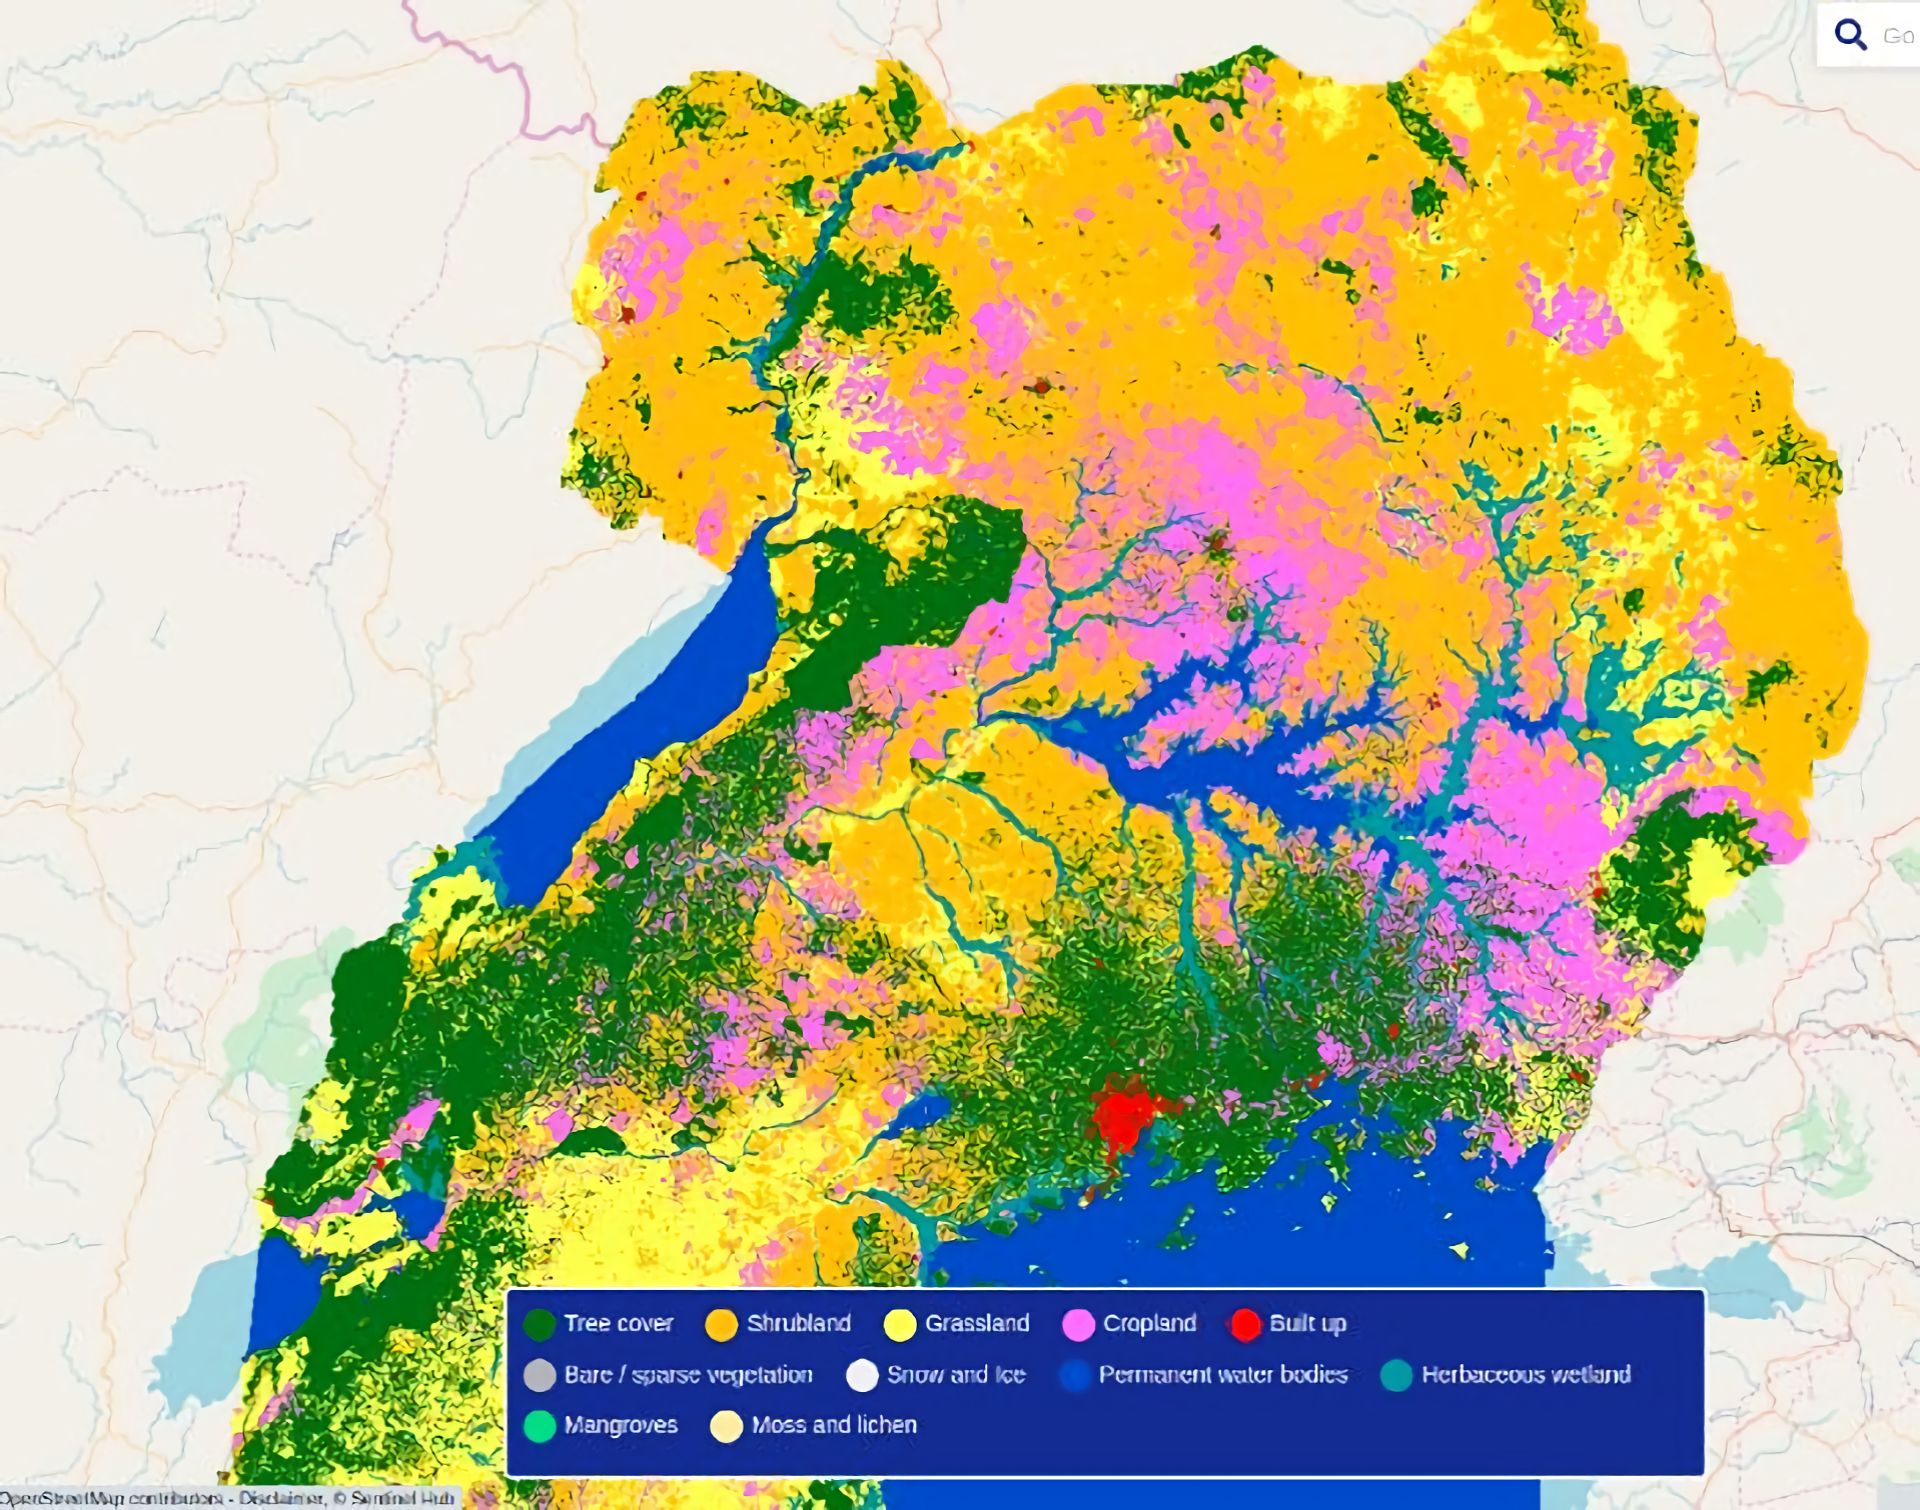
Advances in EO Cloud Computing: OpenEO
Details
This webinar explores the growing role of cloud computing in analyzing and processing Earth Observation (EO) data, with a primary focus on OpenEO. OpenEO is a relatively new and innovative initiative to connect to EO cloud back-ends in a simple and unified way. The project maintains the API and process specifications, and an open-source ecosystem with clients and server implementations. Participants will learn about the design and inner workings of the system, as well as existing capabilities and recent advancements of OpenEO. The session will cover interactive computing using the OpenEO web interface and JupyterLab, where attendees will be guided through a hands-on demonstration of a simple analysis workflow implemented on openEO. This practical demonstration will help participants understand the relative capabilities, flexibility, and application areas of openEO.
The webinar aims to equip participants with the knowledge to:
- Understand the key features and latest developments of openEO.
- Gain hands-on experience in implementing a simple workflow on openEO by using the web interface and Python.
- Recognize the strengths and limitations of openEO.
- Get an introduction to interactive analytical processes, demonstrated through Jupyter Notebooks.
The duration of the webinar is 1 hour, followed by a 30-minute live Q&A session. A live chat will be available throughout the webinar.
The webinar is organized under the framework of the EO AFRICA R&D Facility by the Faculty of Geo-information Science and Earth Observation (ITC) of the University of Twente.
Speakers:
-

Associate Professor – Head of the Center of Expertise in Big Geodata Science (CRIB) – Faculty ITC of the University of Twente
https://people.utwente.nl/s.girgin
s.girgin@utwente.nl
Downloads and recordings:
You can find the recording of the webinar in our YouTube Channel or you can watch it here:
16th on the EO AFRICA R&D Facility Webinar Series
Flood extent assessment in East Africa with Sentinel-2 data
Details
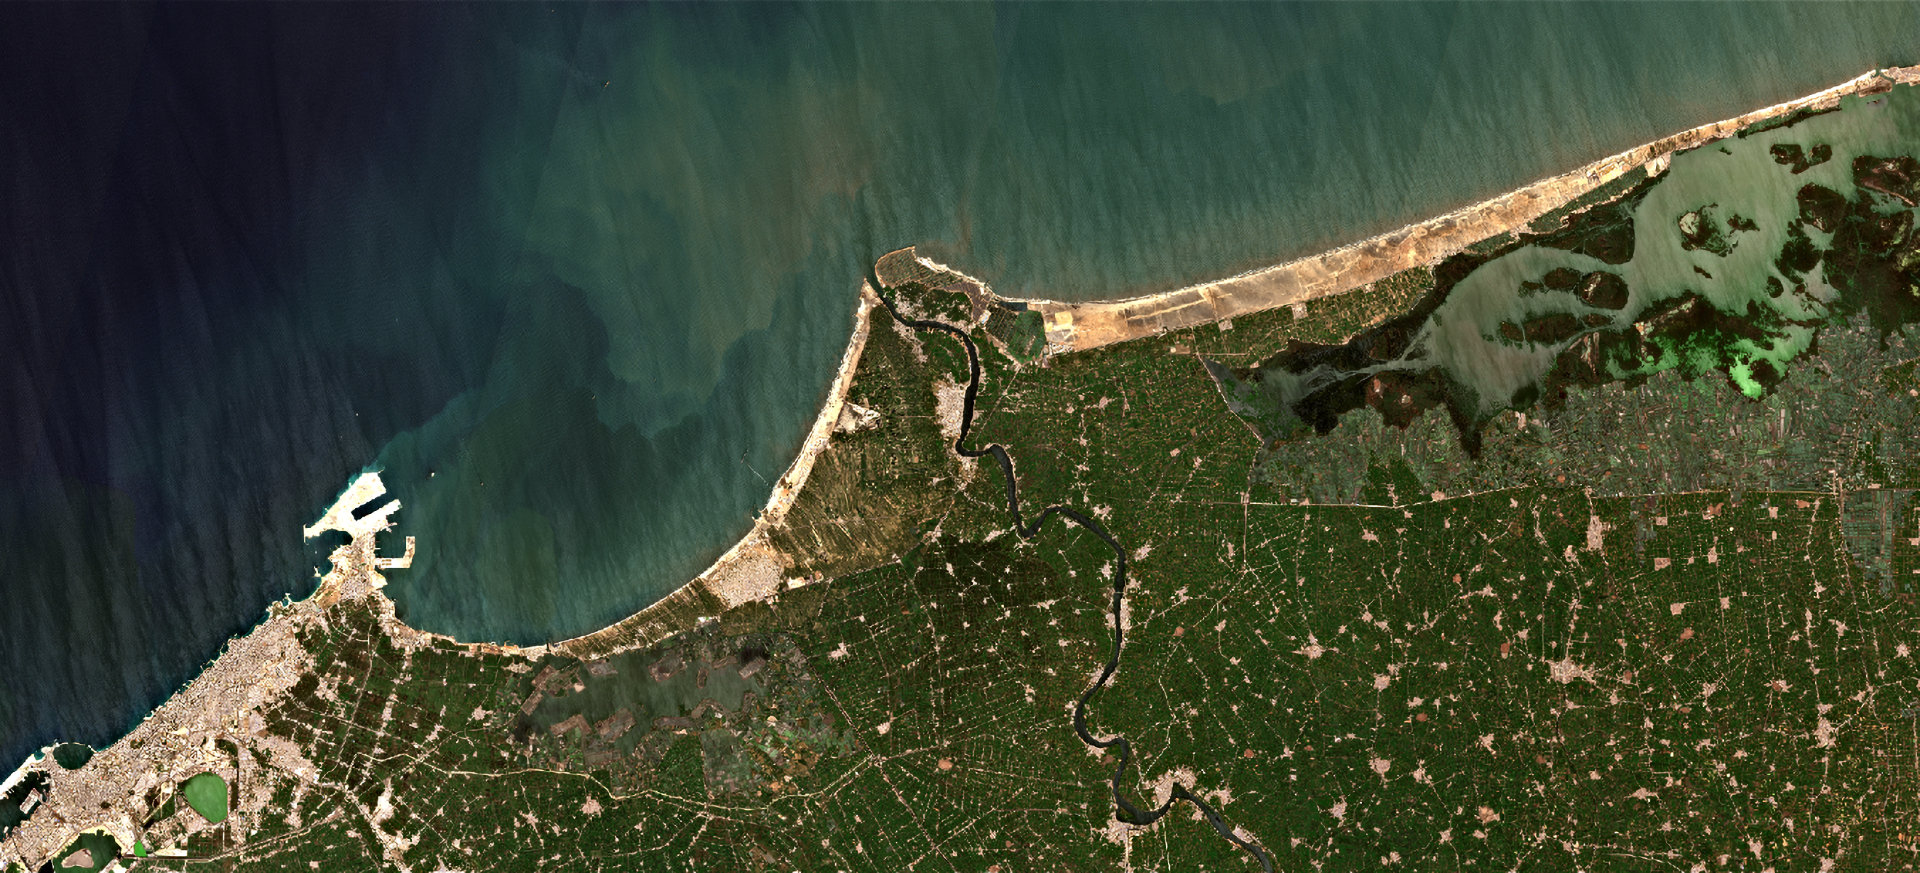
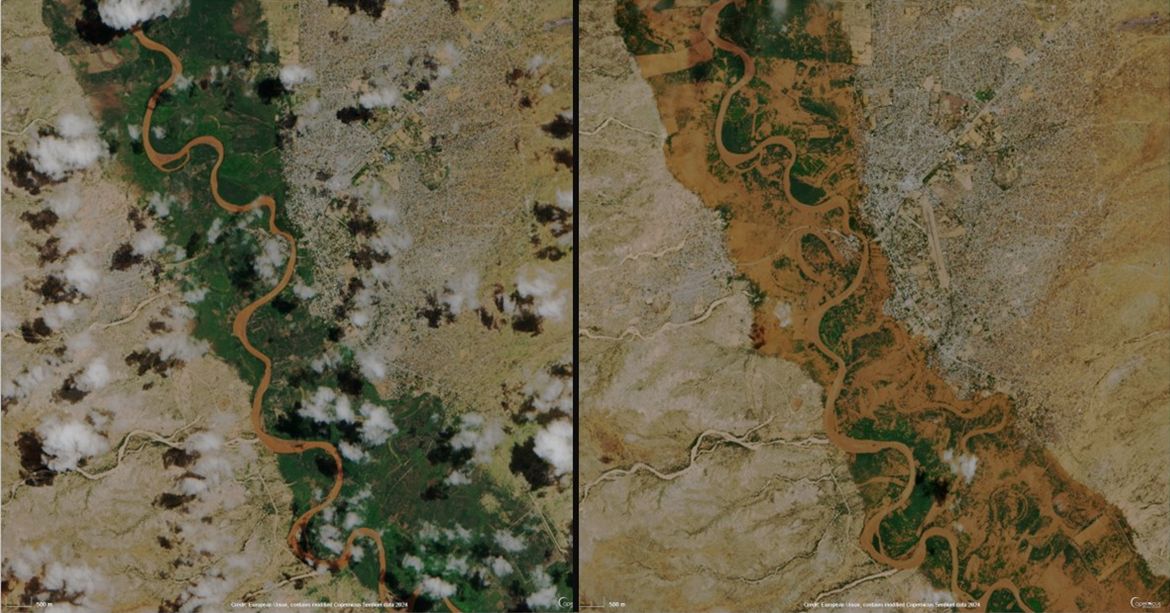
A few months ago, East Africa faced the consequences of weeks of heavy rains and subsequent flooding, attributed in part to the El Niño weather phenomenon, impacting Kenya, Tanzania, Uganda, Rwanda, Burundi, and Somalia. According to the United Nations Office for the Coordination of Humanitarian Affairs (OCHA), the flooding has devastated communities, with over 750,000 people affected and 234,000 displaced across the region. Tragically, the death toll continues to rise, with at least 400 fatalities including over 155 deaths in Tanzania and 257 in Kenya, as per local authorities. Flooding in the area resulted in tens of thousands of individuals requiring necessities such as food, shelter, clean water, and healthcare, and thousands of hectares of crops damaged.
Satellite sensors, play a pivotal role in flood monitoring not only to assess hazards but also to support in early warning, mitigation and protection of lives and properties. The European Commission initiated the Copernicus program a few years ago, introducing a novel series of Earth Observation satellites called the Sentinels. In this webinar we’ll utilize commonly used methods to assess the extent of selected flooded area in East Africa. Presented techniques will include calculation of water radiometric indices from optical Sentinel-2 bands (e.g. MNDWI, NDWI2, SWM) to assess the water extent and change detection in selected area. Practical demonstration using open-access software will guide attendees through basic processing steps to achieve desired results.
The duration of the webinar is 1 hour, followed by a live Q&A session. During the webinar there is a live-chat available as well.
The webinar will be executed under the framework of the EO AFRICA R&D Facility by SERCO Italy S.P.A.
Staff:
-
Remote Sensing Specialist – SERCO Italy S.P.A.
https://www.linkedin.com/in/ewelina-dobrowolska-8180b717b/
ewelina.dobrowolska@serco.com
Downloads and recordings:
You can find the recording of the webinar in our YouTube Channel or you can watch it here:
15th on the EO AFRICA R&D Facility Webinar Series
Accessing cloud services using openEO and additional data processing capabilities offered by ILWISPy
Details
The EO Africa program has been making use of the Innovation Lab as backbone facility for cloud based access to remote sensing data and subsequent data processing. This webinar starts with the use of the Innovation Lab in conjunction with openEO / ILWISPy to access and process also data obtained from other cloud based data repositories.
Attention will be given to relevant cloud based data repositories which can be used to derive a multitude of datasets, like access to the Sentinel suite of satellite images, other relevant archives through API access, like FAO WaPOR, Copernicus Climate Data Store, Royal Netherlands Meteorological Institute and EUMETSAT’s EUMETView. Last but not least some of the capabilities currently offered by WEkEO will be provided.
After a short introduction on openEO and ILWISPy capabilities developed, the webinar is of a highly demonstrative nature using Jupyter Notebooks showing how to access and process the data from the above mentioned cloud based services.
The duration of the webinar is 1 hour, followed by a live Q&A session. During the webinar there is a live-chat available as well.
The webinar will be executed under the framework of the EO AFRICA R&D Facility by ITC-UTwente.
Speakers:
-
Assistant Professor / Project Manager – Department of Water Resources, Faculty ITC of the University of Twente
https://people.utwente.nl/b.h.p.maathuis
b.h.p.maathuis@utwente.nl
Downloads and recordings:
You can find the recording of the webinar in our YouTube Channel or you can watch it here: